Datarails vs. Jirav

Stop waiting on Jirav.
Datarails keeps finance moving.

Jirav times out under pressure, but deadlines don’t. It works if you're formalizing budgeting for the first time, but simple forecasting layered on accounting data only goes so far.

See Datarails in Action

Trusted by finance teams Join thousands of FP&A teams already using Datarails
Capability
datarails dark logo-1
Jirav Logo
System architecture
✓ Excel-native modeling with structured control
✗ Rigid browser-based planning layer
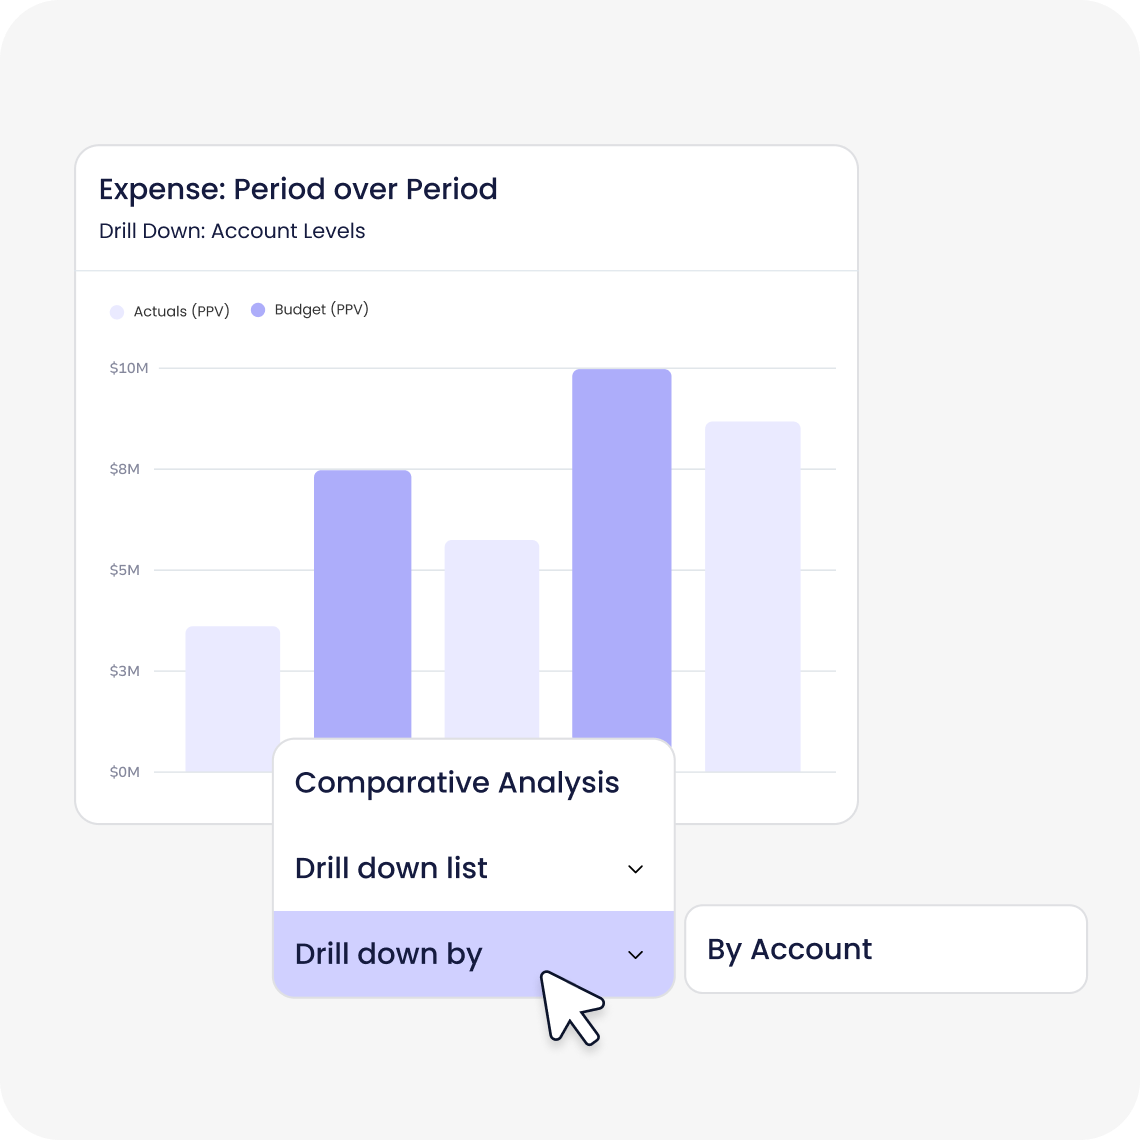
Modeling Flexibility
✓ Flexible Excel modeling with multi-layer formulas and custom ratios
✗ Driver structure limits multi-layered calculations
Consolidation
✓ Automated multi-entity with eliminations and FX
✗ Limited consolidation depth
Performance at scale
✓ Built for large, complex datasets
✗ Sluggish with large datasets
Security & SSO Permissions
✓ Granular permissions at department & account level
✗ Limited access controls
Multi-Currency Support
✓ Native multi-currency capabilities
✗ No multi-currency capabilities
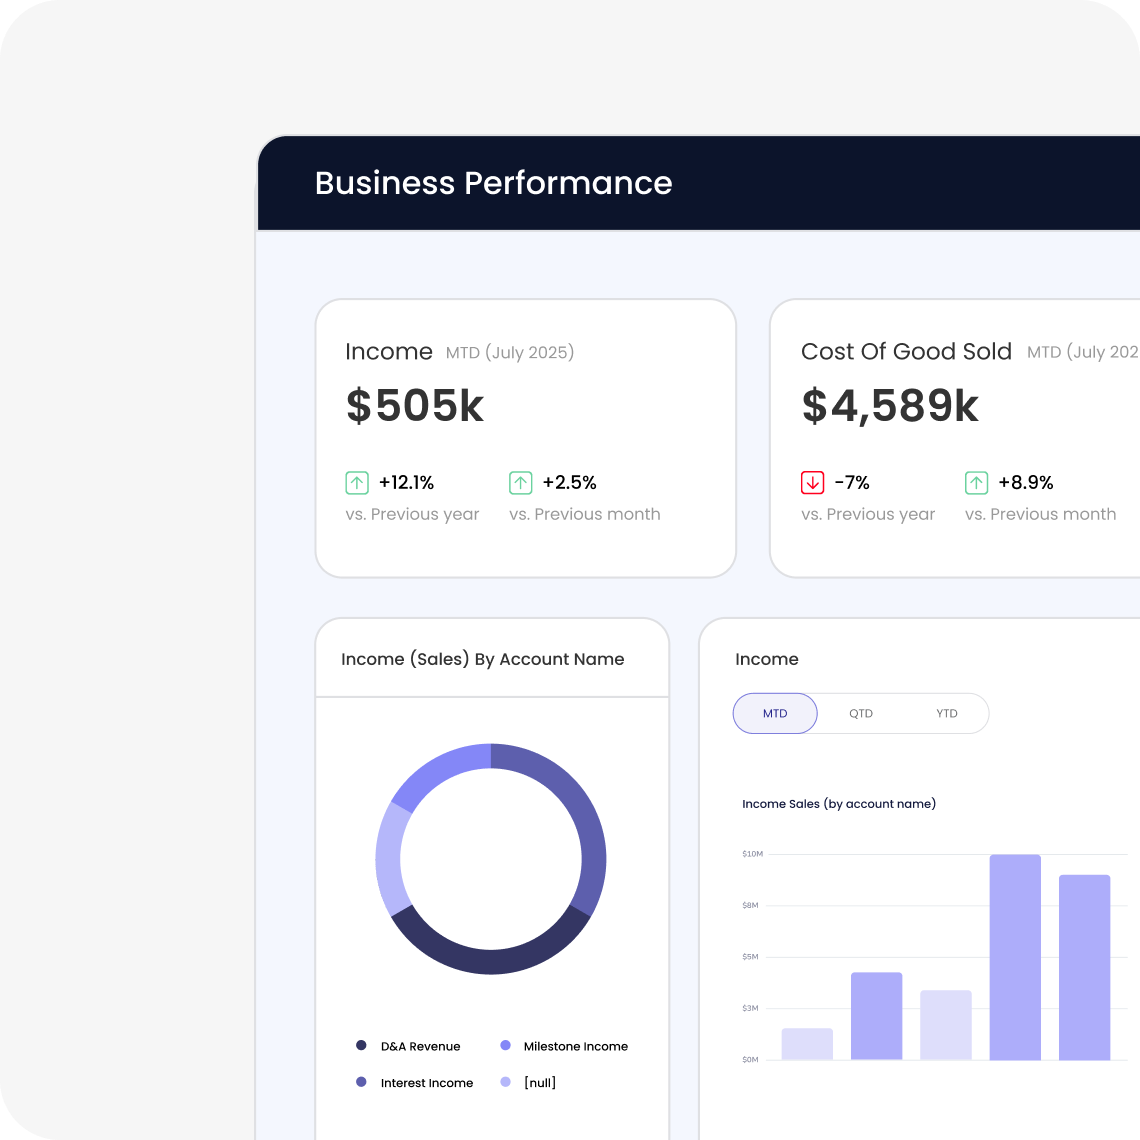
Cash Visibility and Management
✓ Real-time 13-week cash flow forecasting
✗ Forecast-driven only, widens margin of error
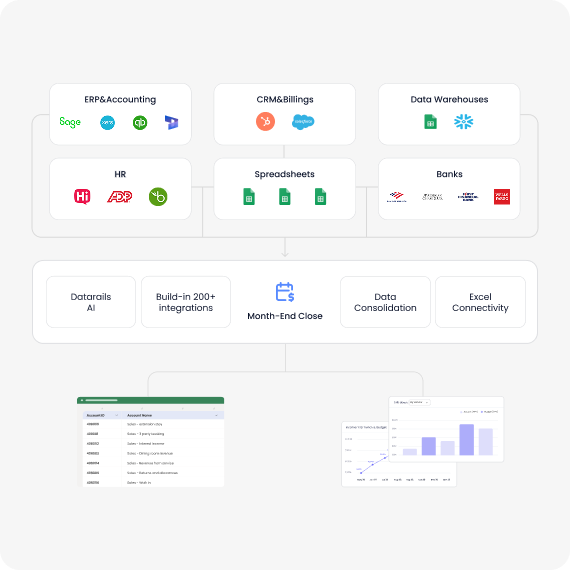
Integration Coverage
✓ Robust, integrates with any platform
✗ Limited, primarily accounting-focused
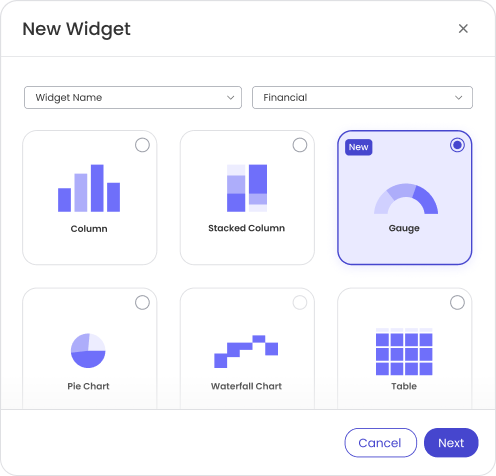
Excel Compatible
✓ Fully native and bidirectional
✗ Closed platform with no Excel connectivity
Implementation ownership
✓ Fully in-house, finance-led
✗ Combined in-house and partner-led

When complexity grows, Jirav slows

Jirav is a driver-based FP&A tool designed for small and mid-sized companies formalizing budgeting for the first time. It offers guided modeling, standard financial statements, and a clean interface. It works well when models are simple.

As data volume, entities, and reporting requirements grow, Jirav’s limits show. Users cite performance slowdowns, rigid reporting structures, and mounting manual workarounds just to keep up. Jirav was built for the starting line, not the finish line.

Datarails supports everything Jirav does and scales far beyond it, delivering enterprise-grade FP&A, multi-entity consolidation, real-time reporting, and presentation-ready outputs while keeping finance teams fully native in Excel.

Where Jirav breaks under pressure

Performance slows when data grows

Jirav users report sluggish behaviour when handling large datasets, detailed charts, and layered models. Running reports or updating models during busy reporting cycles should not come with loading screens and timeouts.

Bulk uploads become a bottleneck

Managing large volumes of data can require multiple manual workarounds, slowing model maintenance and creating friction when forecasting cycles demand speed. Handling large datasets is a basic expectation — not a performance liability.

No single view of financial performance

Jirav does not display budget, actuals, forecast, and prior year in a single dashboard. Teams must create separate reports and manually compare figures, often toggling between views to piece together the full story. Leaders need one unified view to evaluate financial health quickly.

Formulas can’t stack

Jirav’s structured driver framework doesn’t support the complex logic that real budgets demand. Users report limitations with stacked formulas, custom ratios, and advanced modeling. As planning scenarios expand, analysis moves back into the spreadsheets that Jirav was supposed to replace.

No spreadsheet support

Jirav pushes teams to operate fully inside its proprietary cloud environment, yet leadership, investors, and operating teams still request spreadsheet models. To make matters worse, Jirav's MS365 connectivity lags behind even its own Google Sheets integration, leaving finance teams manually exporting reports back into Excel just to meet the expectations of the people they report to.

You outgrow it faster than expected

Jirav supports models with a limited number of drivers, small set of active scenarios, standard ratios, no multi-currency, and no multi-subsidiary consolidation. As entities expand and reporting becomes layered, teams often add tools to fill consolidation and cash visibility gaps, increasing operational overhead.

Datarails: Built for the complexity Jirav can’t handle

Build complex models without formula limits

Driver frameworks often restrict advanced financial logic. Datarails keeps modeling fully native in Excel so teams can build multi-sheet models, layered formulas, and custom calculations without platform constraints.

See the full financial picture instantly

Finance leaders should not toggle between dashboards to understand performance. Datarails brings actuals, forecast, budget, and prior year together in one view so teams can analyze performance without assembling reports manually.

Consolidation and close across 600+ systems

Datarails automates multi-entity consolidation with eliminations, FX translation, and audit trails across 600+ ERP and operational systems, simple to expand as your tech stack evolves.

Turn analysis into board ready reporting

Instead of exporting data and rebuilding reports in spreadsheets, Datarails transforms live financial models into dashboards and presentation ready outputs automatically, keeping reporting fast and consistent. Zero manual formatting.

Control access and workflows with precision

Basic access controls are not enough. Datarails provides granular permissions at the department and account level, along with built-in workflows to manage planning, approvals, and close processes. Everyone works from the right data while finance maintains full control.
Eliminate manual forecasting
Single source of truth
Model scenarios
Forecasting models
Collaborative workflows

Learn why finance teams choose Datarails

Badge Badge Badge Badge

Don’t just take our word for it

“Without Datarails, I would’ve needed to double my current team of three just to produce what we’re delivering today”

Steven Carkey VP Finance Operations, 100%
100logo_2021-01-22-10-57-34-1

“Thank goodness we went with Datarails, because there’s no way we’d be where we are as a team.”

Charlotte Kelly Head of FP&A, Butternut Box

“Datarails gives us a single source of truth. That kind of visibility changes everything.”

John Smith CFO, CDG

FAQ

Datarails is built for finance teams that have outgrown starter FP&A tools. It handles multi-entity consolidation, complex modeling, direct bank connectivity, and 600+ integrations, all while keeping your team fully native in Excel. Jirav works for small teams formalizing budgeting for the first time, but its driver-based structure limits growth as complexity increases.

Yes. Many customers run a parallel period during implementation to ensure continuity. Our implementation team will create a phased migration plan with you to ensure a smooth, low-risk transition.

 No. Because Datarails is native to Excel, your existing models, formulas, and structures are preserved. Unlike closed-environment tools that require rebuilding everything in proprietary syntax, Datarails enhances what you already have. 

Yes. Datarails is designed to be fully finance-owned. Your team builds, edits, and updates models directly in Excel without needing IT involvement or platform specialists. When you need support, Datarails' onboarding and customer success teams are in-house and always available — no third-party partners, no support tickets routed through consultants.

Datarails automates multi-entity consolidation with eliminations, FX translation, and audit trails across 600+ ERP and operational systems, all within a unified Excel-native platform. There is no cube structure to configure or maintain. Finance teams own the consolidation logic directly and can update it as the business changes. 


A clean interface is great, but it doesn't close the books. Datarails combines a modern, intuitive UI with the analytical depth finance teams actually need. Your team gains power without losing usability, and keeps the familiar Excel experience intact.

Ready to leave Jirav behind?

Join 1,000+ finance teams who switched to Datarails for version control, workflow automation, and professional-grade visualizations.